Figure 3.
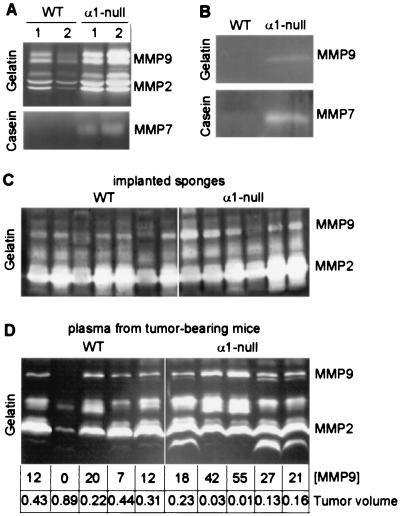
MMP synthesis in wild-type (WT) and α1-null mice. (A) Gelatin and casein zymograms of conditioned media from full thickness skin explants from two wild-type and two α1-null mice. Increased levels of MMP2 (72- to 74-kDa pair), MMP9 (92- to 94-kDa pair), and MMP7 (21–28 kDa) are seen in the two α1-null samples as compared with the wild type. (B) Gelatin and casein zymograms of conditioned medium from wild-type and α1-null primary endothelial cells showing increased level of MMP9 and MMP7 in the α1-null cells. (C) Gelatin zymogram of gelfoam sponges from wild-type and α1-null mice. In most samples, MMP9 levels are increased in α1-null samples relative to the wild-type samples. (D) Gelatin zymogram of plasma from tumor-bearing wild-type and α1-null mice showing similarly increased levels of MMP9 in the plasma from α1-null samples. MMP9 bands were quantified by densitometry and compared with the measured tumor volume (cm3) for each animal. There is a striking inverse correlation between MMP9 expression and tumor size within the two groups.

