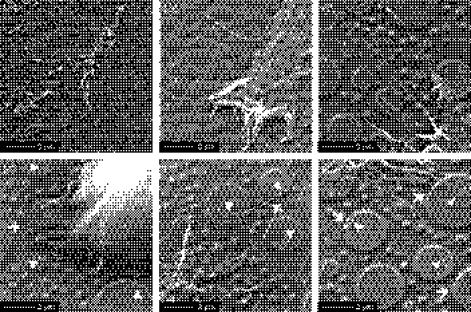
Figure 3.
High‐magnification SEM images of hFOB cells cultured for 24 h on surfaces with (a) 11 nm, (b) 38 nm and (c) 85 nm surfaces. Additional examples of hFOB cells cultured on 85 nm substratum are shown after 3 h ((d),(e)) and 24 h (f) of culture. Arrowhead and arrow indicate the interaction with top and other portions of island topography, respectively. Scale bars indicated.

