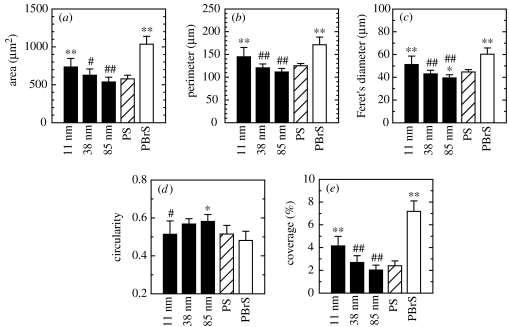
Figure 5.
hFOB cell dimensions after 3 h of culturing on nanoislands and flat substrata analysed by ImageJ software: (a) area, (b) perimeter, (c) Feret's diameter, (d) circularity and (e) percentage coverage per unit substratum surface area. Statistical significance examined by ANOVA followed by Student–Newman–Keuls post hoc multiple comparison test is shown. When compared with the flat PS control, statistical significance is denoted by * (p<0.05) and ** (p<0.01). When compared among nanoisland substrata, it is denoted by # (p<0.05) and ## (p<0.01), where the nanoisland substratum displaying the highest value is set as the control for the individual parameter. For example, the 11 nm substratum was set as the control for area, perimeter, Feret's diameter and coverage, and the 85 nm substratum for circularity.

