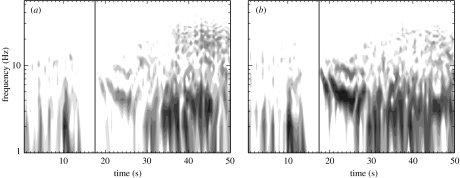
Figure 2.
The windowed power spectra (WPS) for the two ECoG time-series shown in figure 1. Here, subfigures (a) and (b) correspond to the time-series X and Y in figure 1, respectively. The WPS are plotted in logarithmic greyscale with black and white denoting regions of high power (greater than 30 μV2) and low power (less than 0.03 μV2), respectively. The vertical line in the figure at t=17.5 s denotes the approximate onset of seizure.

