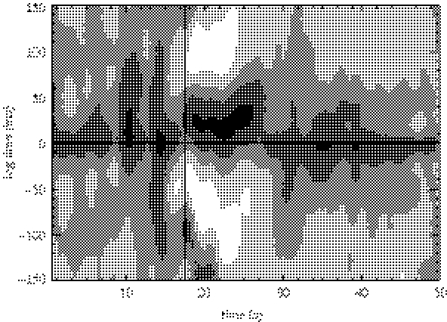
Figure 3.
The windowed cross-correlation between the two ECoG time-series shown in figure 1. The WCC are plotted in linear greyscale with regions of strong correlation (greater than 0.8) and anticorrelation (less than −0.8) denoted by black and white, respectively. The vertical line in the figure at t=17.5 s denotes the approximate onset of seizure. The horizontal line in the figure denotes the zero lag.

