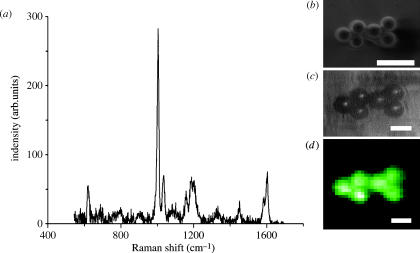
Figure 2.
Raman spectrum (a) of the first bead from the left, show in electron micrograph (b). (c) Five μm diameter polystyrene beads, transmission light micrograph observed trough the objective lens; inset (d) corresponding Raman image (1 pixel=1 μm) using the 1004 cm−1 band of polystyrene. Scale bar in (b) represents 10 μm, and in (c) and (d) 5 μm.

