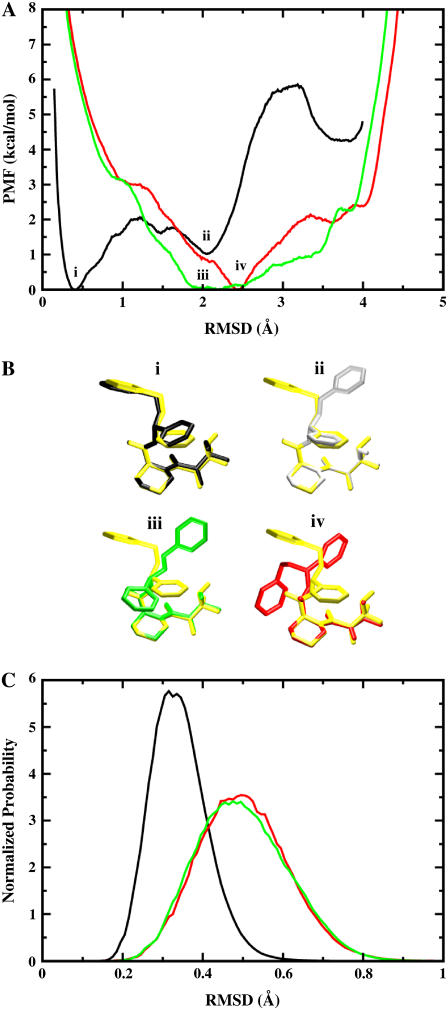
FIGURE 5.
PMF calculations on the conformational restraints for ligand 8 in complex with FKBP12. (A) PMF curves for ligand 8 in the binding site (black), in the bulk solution (green), and in vacuum (red). The callouts i and ii label the minima of the PMF for the ligand in the binding site. The callouts iii and iv label the minima of the PMFs for the ligand in the bulk solution and in vacuum, respectively. (B) The average structures of the ligand around the minima are shown together with the average structure of the ligand in the equilibration (shown in yellow). The average structures of the ligand around the minima i, ii, iii, and iv are colored in black, gray, green, and red, respectively. The structures are aligned along the piperidine ring in ligand 8. (C) The normalized Boltzmann factors exp[−β(wc(ξ) + kcξ2)] with a force constant kc = 10 kcal/mol/Å2 for the ligand in the binding site (black), in the bulk solution (green), and in vacuum (red).

