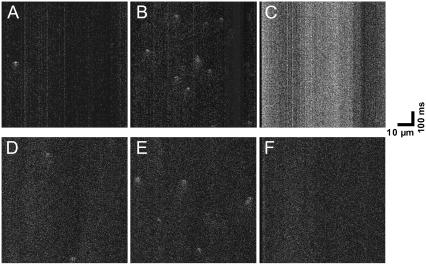
FIGURE 3.
Representative line scanning images of spontaneous Ca2+ sparks in the intact myocyte. (A–C) The images of one myocyte in the absence of 10 μM TPEN. (D–F) The images of another myocyte in the presence of 10 μM TPEN. (A and D) control; (B and E) 0.5 min after 30 μM DTDP; (C and F) 4 min after 30 μM DTDP.

