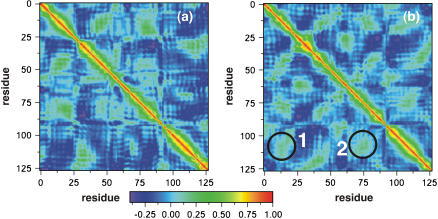
FIGURE 12.
The cross-correlation plots for the α-subunit (a) without and (b) with binding of halothane. The plot is constructed from time average over the last 6-ns of a total of 16 ns of MD simulation for each system. The color scale is also shown. Significant correlations upon halothane binding are shown as 1 and 2.

