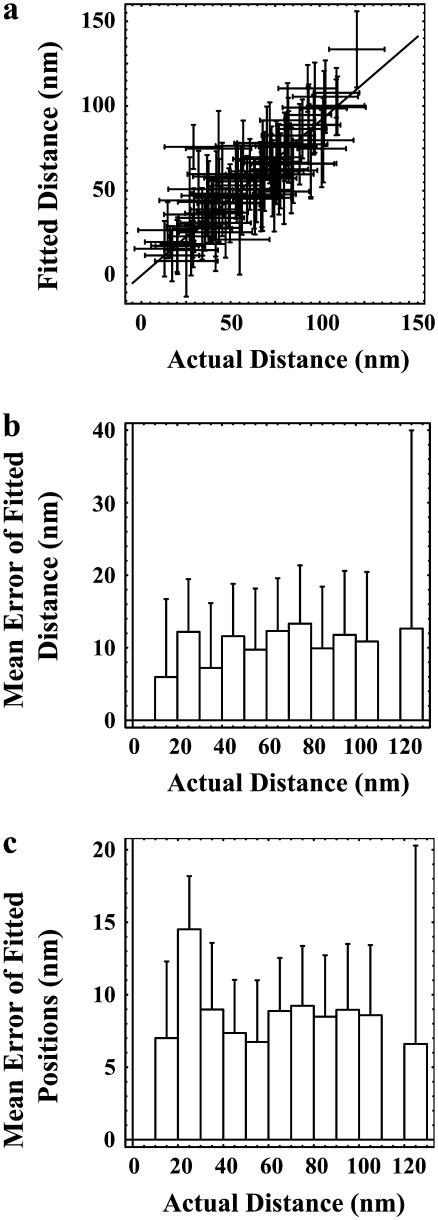
FIGURE 4.
Accuracy of spatial mapping of QD pairs. (a) The fitted distance of separation plotted versus the actual calculated distance of separation was well fit to a line with a slope of 0.91 ± 0.02 (R2 = 0.94). (b and c) Mean accuracy of the fitted distances (91 points) and positions (182 points), respectively, as a function of the actual distance of separation with 10 nm bins (91 points). The number of data points for each distance is shown in Fig. 2 c.

