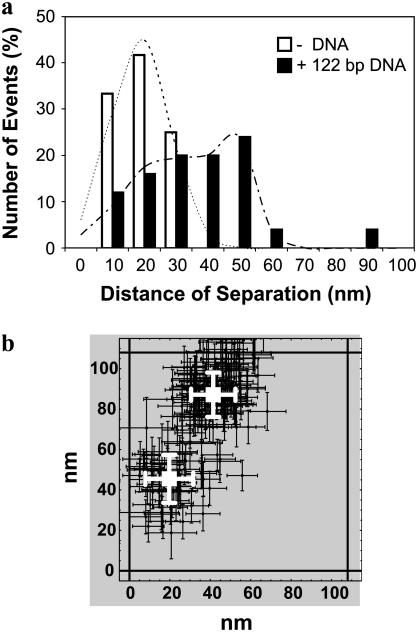
FIGURE 5.
End-to-end distance of 122-bp dsDNA. (a) A histogram of the frequency of events of the distance of separation between two nearby QDs with 10-nm bins. The observed distances of separation in the absence of DNA (open bars; N = 12) are <30 nm, whereas several of the observed distances of separation in the presence of DNA (solid bars; N = 24) are >30 nm. We determined the mean and standard deviation of the distance of separation in the absence of DNA to be 19 ± 13 nm (R2 = 0.97) by curve-fitting the observed distance distribution to a single 1D spatial Gaussian (dashed lines). We determined the means and standard deviations of the aggregates in the presence of DNA to be 27 ± 19 nm and 48 ± 9 nm (R2 = 0.96) by curve-fitting the observed distance distribution to the sum of two 1D spatial Gaussians (dot-dashed line). (b) A typical example of a QD aggregate in the presence of 122-bp dsDNA. These two nearby QDs were found to be separated by 47 ± 16 nm.

