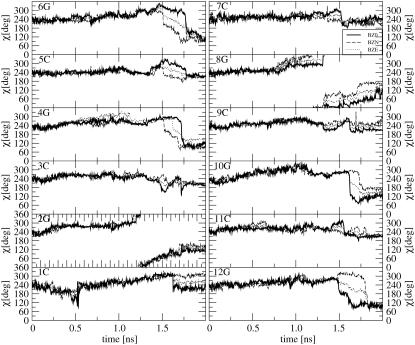
FIGURE 6.
Time-series of the nucleotide-base dihedral angle χ (around the sugar-base bond) during the TMD simulations of the B-to-Z transition under different ionic-strength conditions (BZ0, solid line; BZN, dashed line; and BZE, dotted line; see Table 1 for the simulation codes).

