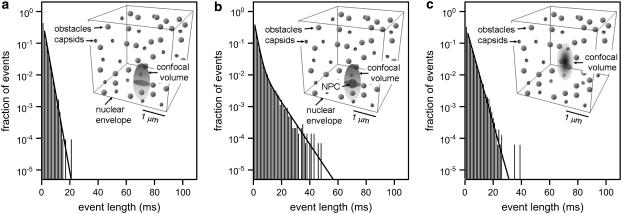
FIGURE 6.
Simulation of FCS experiment. Histograms of lengths of fluorescence bursts. Identical to the plots in Fig. 5, the plots in panels a and c are fitted by an exponential decay, whereas the plot in b is fitted by a double-exponential decay, with one decay rate retained fixed with the value obtained in panel a. The decay rates obtained are (a)  , (b)
, (b)  and
and  , and (c)
  . Sketches of the simulated structure for each situation are shown as insets.

