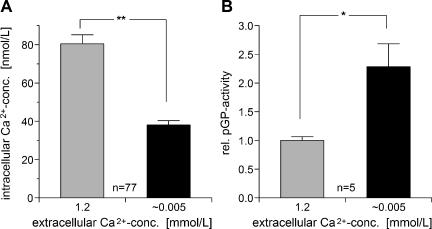
Figure 5.
Impact of extracellular Ca2+ concentration on (A) intracellular Ca2+ concentration [Ca2+]in (n, number of cells investigated) and (B) on the activity of pGP (described by the ratio of rhodamine-123 efflux rates in the presence or absence of VPL, respectively; n, number of experiments). Values are expressed as mean ± SEM. *P < .05; **P < .001.

