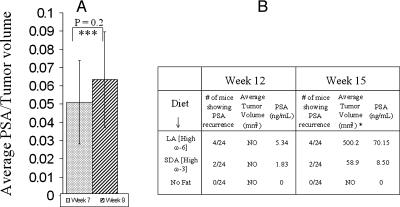
Figure 6.
(A) Average PSA per tumor volume in the no-fat diet-fed mice on week 7 vs week 9 (n = 72). ***P = .2. (B) Number of mice showing tumor recurrence, average tumor volume, and PSA, after tumor resection, in mice fed no-fat, high ω-3 SDA, and high ω-6 LA diets on week 12 vs week 15. NO, not observed. *Estimated value.

