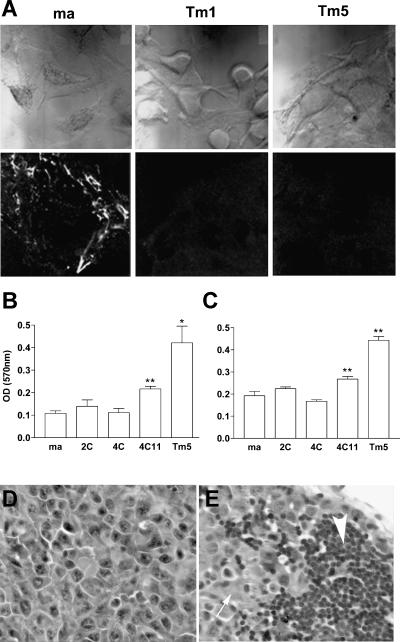
Figure 2.
Morphologic and functional characteristics of melan-a-derived cell lines. (A) Phase-contrast microscopy (upper panels) and indirect immunofluorescence depicting fibronectin deposition on ECM by melan-a, Tm1, and Tm5 cells, using a specific polyclonal antibody against fibronectin (lower panels). Adherent cell number, as measured by an MTT protocol, after plating cells for 30 minutes in fibronectin-coated (B) or laminin-coated (C) wells. Paired t test was used for statistical comparisons between melan-a cells and derived lineages (*P < .05, **P ≤ .01). Histologic analysis of tumor masses (D) and axillary lymph nodes (E) obtained from syngeneic mice injected with 106 cells, 14 days after injection. The large arrow indicates axillary lymph node, and the small arrow shows infiltrating melanoma cells. H&E staining, x40.

