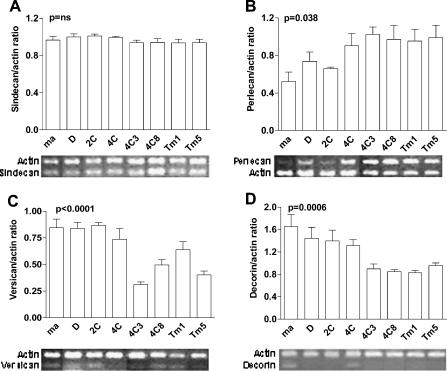
Figure 5.
The expression of perlecan, versican, and decorin, but not syndecan-4, becomes altered during melan-a transformation. cDNA obtained from RT was diluted and amplified by semiquantitative PCR for syndecan-4 (A), perlecan (B), versican (C), and decorin (D), with resulting products visualized on agarose gel. Ethidium bromide staining intensity was analyzed for each gene and for an internal control (β-actin). Numbers on the y axis represent the mean ratio between protein core/β-actin expression for each cell type, determined for four different cDNA dilutions. Amplified products from one initial cDNA dilution are depicted below each panel for syndecan-4 (1:16), perlecan (1:16), versican (1:8), decorin (1:2), and β-actin (same dilution as that of the respective protein core). ma, melan-a; D, melan-a submitted to adhesion blockade for 24 hours. ANOVA tests were used for statistical analysis.

