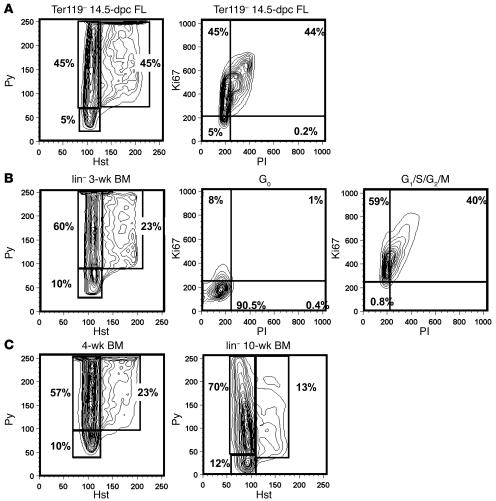
Figure 2. FACS profiles of the distribution of G0, G1, and S/G2/M cells in different lin– populations.
(A) Representative FACS contour plot for 14.5-dpc Ter119– FL cells after staining with Hst and Py and for Ki67. (B) Representative FACS contour plot for lin– 3-wk BM cells after staining with Hst and Py; sorted G0 cells after staining for Ki67 (>90% of the G0 cells showed no Ki67 expression); and sorted G1/S/G2/M cells after staining for Ki67 (>99% of the G1/S/G2/M cells expressed Ki67). (C) Representative FACS contour plots for lin– 4- and 10-wk BM cells after staining with Hst and Py. Percentages indicate the proportion of total cells found within the indicated gene.

