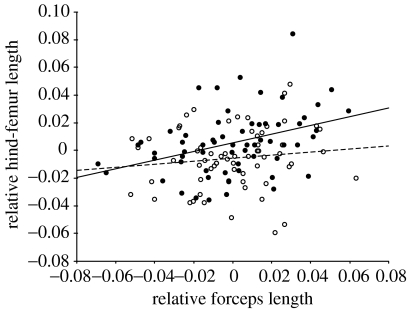
Figure 4.
Scatterplot and least squares regression lines for relative hind-femur length and relative forceps length in F. auricularia. Brachylabic males=open circle and broken line (β=0.114±0.112; t62=1.02, p=0.313) and macrolabic males=filled circle and solid line (β=0.313±0.099; t60=3.16, p=0.002). Residuals were calculated from least squares regression of the log transformed trait on log pronotum width. For forceps length, the residuals were calculated separately for each morph.

