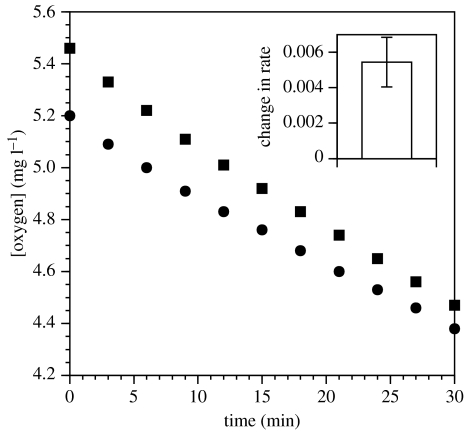
Figure 1.
Rate of decline in oxygen concentration for a P. carnea colony before (squares) and after (circles) treatment with avicin extracts (10 μg ml−1). For five colonies of each treatment, inset plot shows the mean±s.e.m. of the before/after difference in the rate of decline in oxygen concentration, where this decline is measured by the least-squares slope of oxygen concentration versus time. This difference in rate was significantly positive, i.e. the oxygen uptake decreased after treatment.

