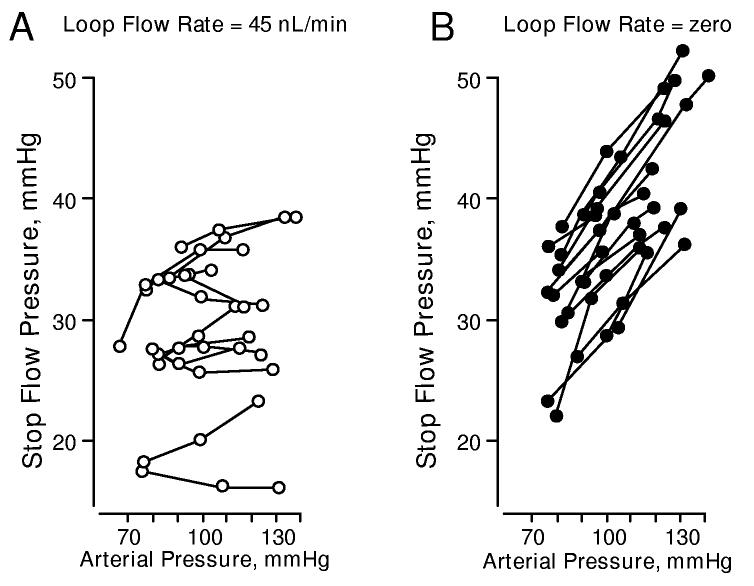
Figure 9.
An example of PGC regulation during a constant early distal flow rate of 40 nl/min (A, left) and the disturbance of pressure regulation under zero flow conditions (B, right) in the anesthetized rat. PGC was estimated by micropuncture measurements of early proximal tubule “stop-flow” pressure. Renal perfusion pressure was altered by an aortic clamp placed proximal to the renal artery. Flow rate was altered by microperfusion of the loop of Henle. (data reproduced with permission from reference 131).

