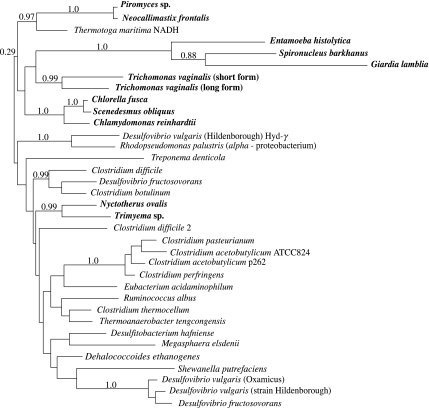
Figure 2.
Phylogenetic tree showing the evolutionary relationships between [Fe]-hydrogenase sequences from eukaryotes and eubacteria. Eukaryotes are shown in bold. Details of the analysis on 196 aligned positions are given in the legend to figure 1. The strongly supported groups have also been recovered in previously published analyses using different methods, including maximum-likelihood, and different support measures including bootstrapping (Horner et al. 2000).

