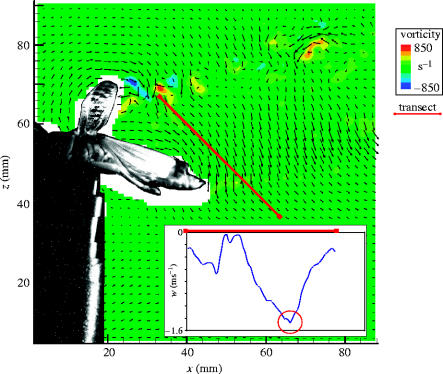
Figure 1.
Shows a typical DPIV vector map with the freestream subtracted and with every other vector (in both x- and z-directions) removed for clarity. The locust has been overlain for spatial reference. The red line indicates where the transect was measured within the plane. The plane itself was 25.5 mm from the centre of the disc, corresponding to approximately 0.5R. The inlay graph shows the vertical component of the locust-induced flow against the transect length. The red ring highlights the maximum downward flow velocity along that transect, and corresponding to one data point in the following analysis.

