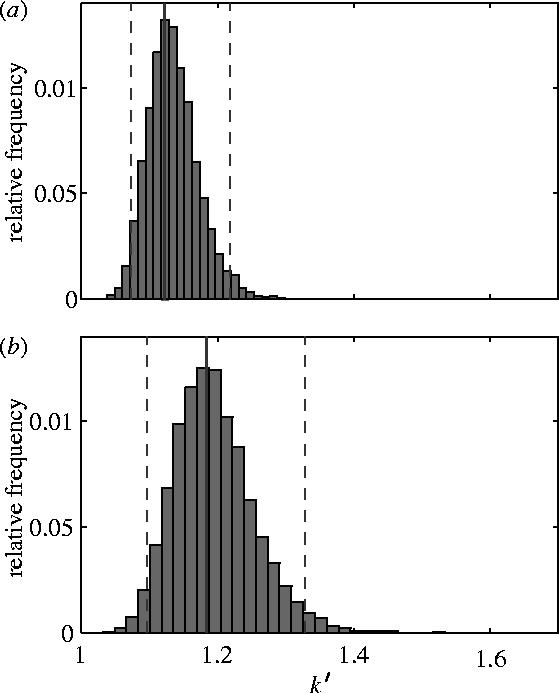
Figure 4.

Histogram of relative frequency of estimates of (a) the efficiency factor k and (b) the modified efficiency factor k′ from a Monte Carlo analysis in which the values of the coefficients of the cosine series describing the downwash distribution were allowed to vary as samples from t-distributed populations based on the standard errors of the coefficients. The solid vertical line on each graph marks the best estimate of k or k′ based on the best fitting values of the coefficients; the dashed lines denote the upper and lower 2.5 percentiles, giving 95% confidence limits for k and k′.
