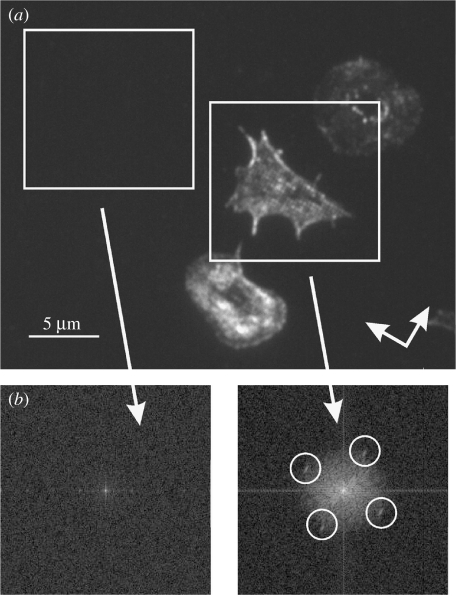
Figure 7.
(a) Actin labelled platelets on a nanopitted surface. The surface has a square array of 120 nm diameter pits on a 300 nm pitch with the orientation indicated by the arrows. (b) Corresponding FFT of the left-hand side image. The condensation of the actin cytoskeleton reacts to the underlying nanotopography. The position of the four peaks (white circles) corresponds to the 300 nm periodicity of the underlying nanotopography. The corresponding FFT of the flat surface image shows no characteristic features related to the underlying nanotopography.

