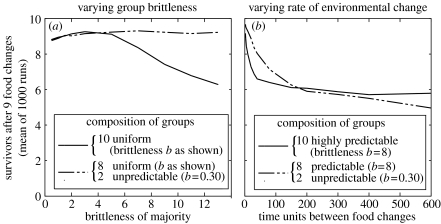
Figure 3.
Effect of group and environment on survival (simulation). This shows the same overall task as figure 2, but with a much wider variety of groups. In (a) and (b), each datapoint indicates the number of survivors after nine food changes, one each 10 t.u., from an independent group initially of 10 members. (a) shows the effect of the predominant population brittleness on survival. The solid line shows that the survival of a completely uniform group reduces when their brittleness b exceeds 5. The dashed line is produced in exactly the same way, except for the substitution of two unpredictable individuals for two of the others. (b) shows the effect of the rate of environmental change on group survival. When food changes occur more frequently than once every 150 t.u., the presence of unpredictable individuals improves group survival. For discussion see text; for details see appendix A.

