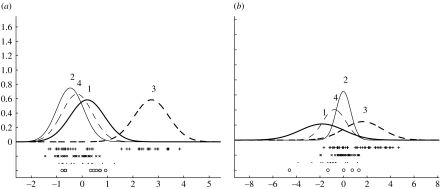
Figure 5.
Inferred densities for (a) GRB7 and (b) ERBB2 for the Sorlie et al. (2001) dataset, with + the expression values for samples identified with process 3. Though only over-expressing in process 3 a subset of samples do not over-express GRB7 suggesting a possible subprocess within this process. In this and subsequent figures individual expression values are marked ○ if the samples are associated with process 1, × with 2, + with 3 and · if associated with process 4.

