
Figure 3.
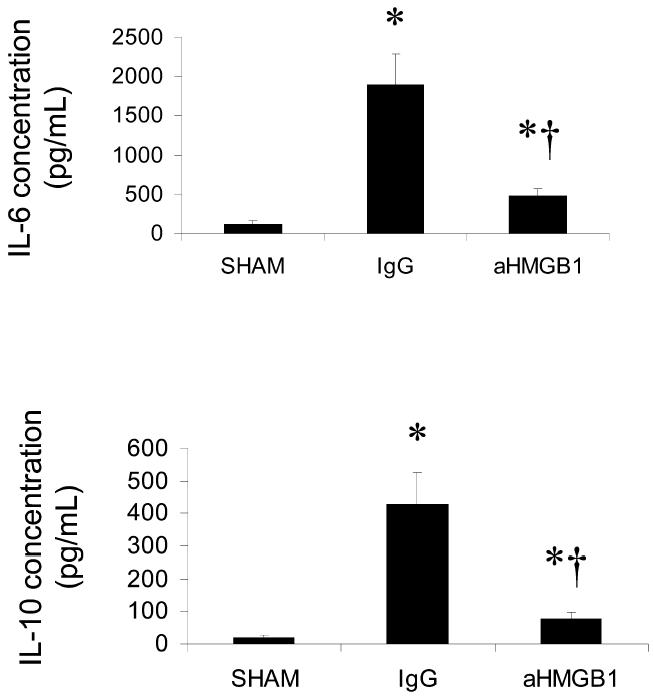
Effect of treatment with anti-HMGB1 antibody on HS/R-induced changes in serum IL-6 (A) and IL-10 (B) concentrations. Cytokine levels were assessed 24 h after HS/R (or the sham procedure). Groups and sample sizes are the same as in Figure 1. Results are means ± SEM. *P < 0.05 vs. sham; †P < 0.05 vs. IgG.