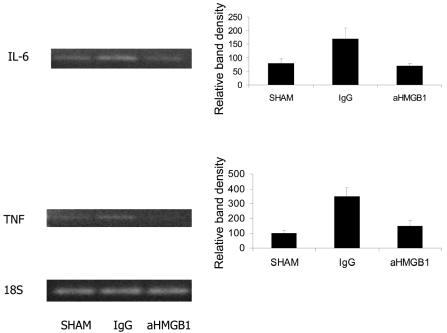
Figure 4.
Effect of treatment with IgG or HMGB1 antibody on the expression of TNF, iNOS, and IL-6 mRNA in samples of intestinal mucosal tissue. RT-PCR was performed using tissue samples obtained 24 h after HS/R. Bands visualized after agarose gel electrophoresis of PCR reaction products were scanned using a NucleoVision imaging workstation and quantified using GelExpert release 3.5. Data are means ± SE (n = 3 per condition). A typical gel is depicted.

