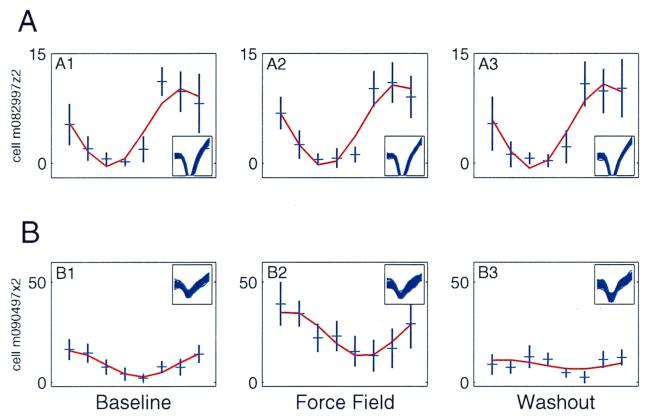
Figure 2.
Examples of cell activity recorded in the primary motor cortex. (A1) The tuning curve of a neuron in the baseline condition. The direction of movement is plotted in the abscissa, and the firing rate (in Hz) is plotted in the ordinate. The firing rate was recorded for approximately 20 trials for each movement direction. The plot shows the average activity and the SD for each direction (in blue) as well as a cosine fit (in red). Waveforms corresponding to single spikes recorded in the baseline are plotted in the bottom right quadrant. (A1– 3) A kinematic cell. The tuning curve recorded in the baseline condition (A1) remained unchanged after the adaptation to the force field (A2) and in the following washout (A3). (B1– 3) A dynamic cell. The tuning curve recorded in the baseline condition is transformed in the force-field condition (B2), but returns to its original shape during the washout (B3).

