
Fig. 1.
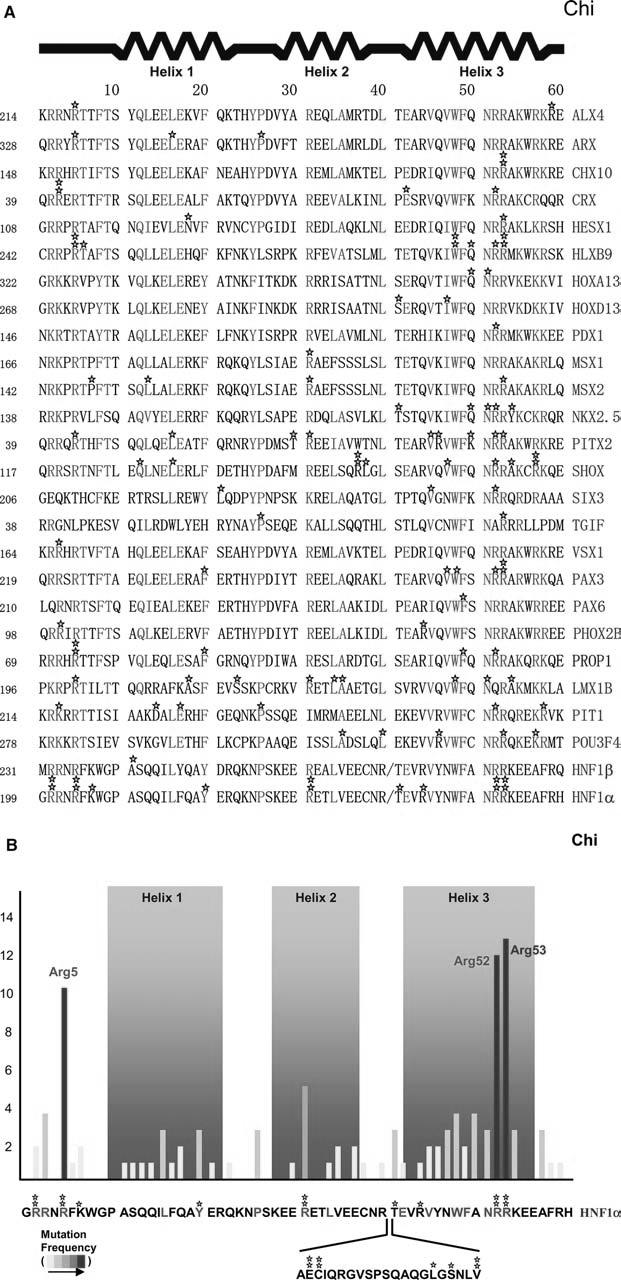
Disease-causing missense mutations found in homeodomains and their frequencies. a Individual unique mutations are indicated by stars. Numbers given before each sequence indicate the beginning number of the amino acids, but the residue numbers used in the text follow the conventional numbering system of 1-60 shown top. In the sequence alignment, strictly conserved and highly conserved residues are red and green, respectively. b Mutation frequencies are determined by the number of independent missense mutations found on a particular residue and indicated by a yellow-to-red color scheme. The HNF1α sequence, as a prototype, is shown bottom with the atypical 21 residue insertion between helix 2 and 3