
Fig. 2.
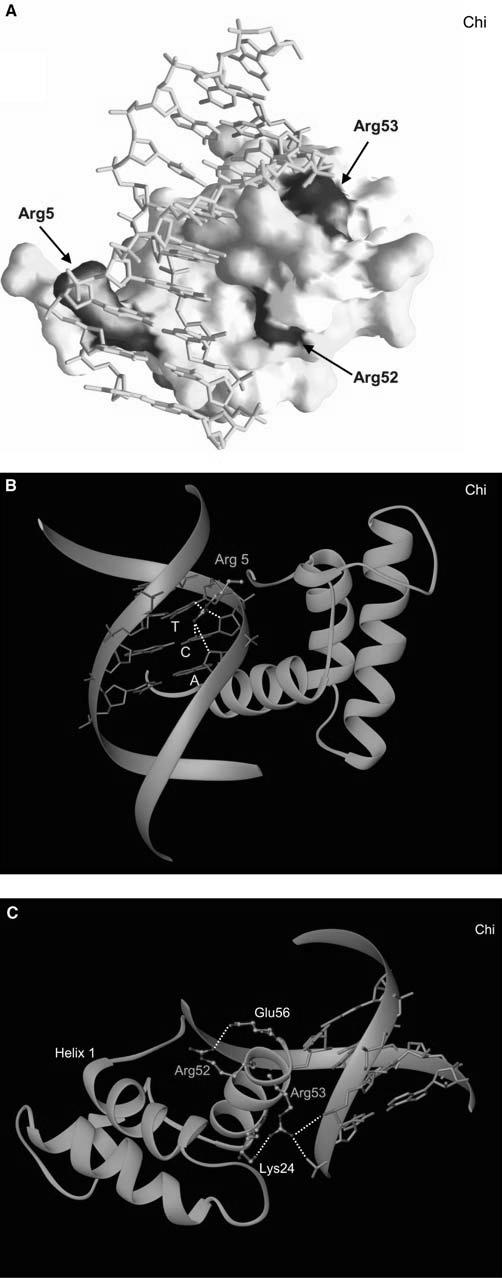
Mapping of mutations to the homeodomain structure and a detailed structural view of each mutational “hot spot” in HNF1α. a Surface representation of the homeodomain bound to DNA, with mutation sites colored according to the frequencies shown in Fig. 1. b A close-up view of Arg5 and its interactions with DNA. c A close-up view displaying Arg 52 and Arg 53 and their interactions with DNA and neighboring residues. In the majority of homeodomains, there is an additional salt bridge between Arg52 and Glu17 on the first helix to assist the anchoring of the recognition helix at the major groove