
Figure 3.
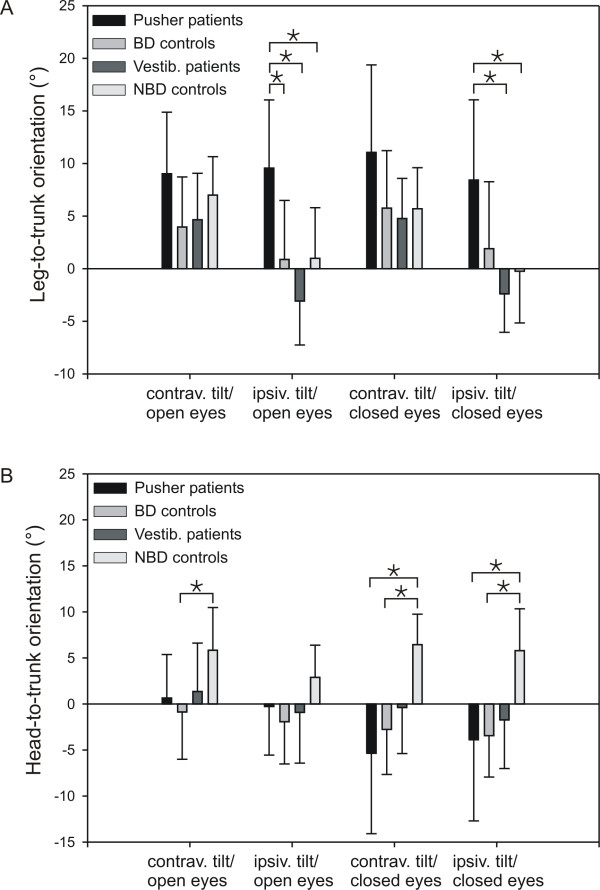
(A) Mean leg-to-trunk orientation of all four subject groups for both directions of body tilt and both viewing conditions. Positive values indicate a relative orientation of the leg into the ipsiversive/right direction; negative values into the contraversive/left direction. (B) Mean head-to-trunk orientation of all four subject groups for both directions of body tilt and both viewing conditions. Error bars indicate standard deviations; asterisks indicate significant differences with p < 0.05.