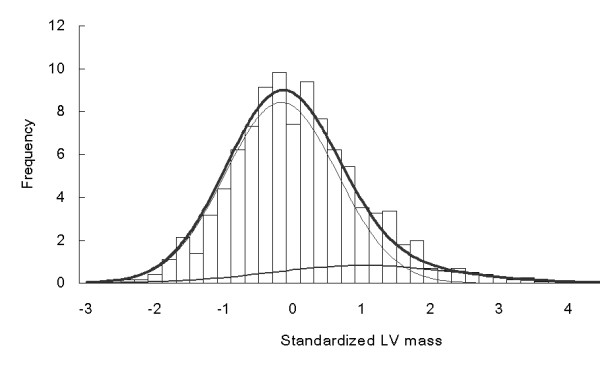
Figure 1.

Observed (histogram) and expected (linear) distributions of adjusted left ventricular mass in the study subjects. Two thin lines were plotted from 2-component Normal distributions with means as (-0.168, 1.029) and variance as (0.661, 1.837), respectively. The thick line was the summation of two thin lines.
