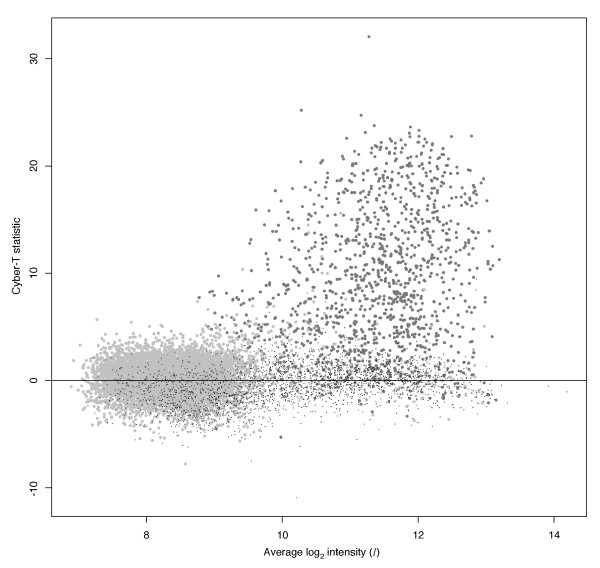
Figure 4.

Distribution of the Cyber-T statistic as a function of average intensity I. Spiked probe-sets are shown as large and dark gray dots, not amplified cRNAs as large and light gray dots, and probe-sets that where not spiked as small black dots.
