
Figure 1.
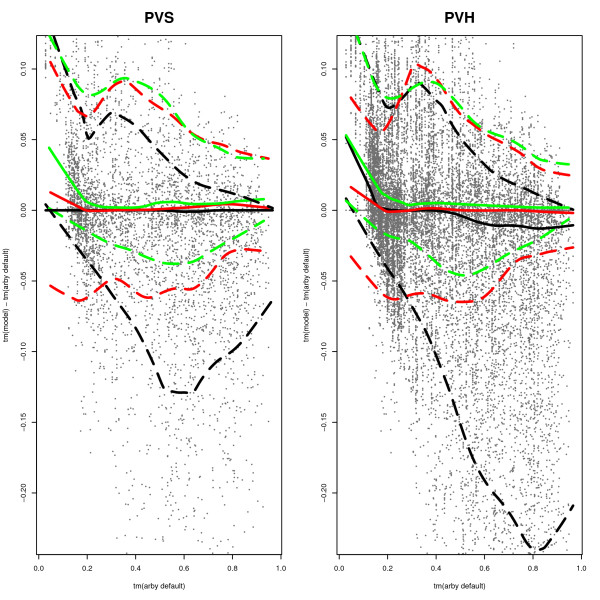
Overview of model quality improvement with respect to the model difficulty. Left for PVS, right for PVH analogously. Each dot corresponds to a model where the x-coordinate is the TM-score of the corresponding default Arby model and the y-coordinate is the TM-score improvement with respect to this default model. Smoothed quantile lines are shown for the 10% (lower dashed), 50% (middle), 90% (upper dashed) quantiles of the models within a sliding window of size 0.15. Black lines represent all models, red lines represent the models selected using FRST, green lines represent the models selected using the SVM approach. For the smoothing evaluations are made at 1000 equidistant points and the resulting quantiles are smoothed with a lowess function (local linear scatter plot smoother). Interpretation: The TM-score of the Arby default gives an indication of how difficult it is to find the right template for a target. For the selection methods random, FRST, and SVM, this plot shows the potential improvement with respect to difficulty of the target. For PVH, more models are generated below default. For both PVS and PVH, the SVM selection performs better than FRST selection, and FRST performs better than random.