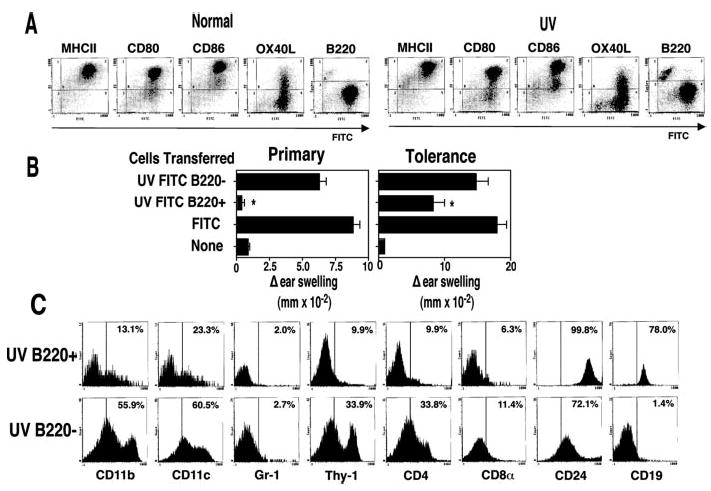
FIGURE 2.

FITC+B220+ cell transfer tolerance. A, FITC-positive cells from hapten-sensitized mice (Normal) or UV-irradiated hapten-sensitized mice (UV) were stained with PE-labeled Abs to various cell surface markers. The data are expressed as fluorescence intensity on a log scale. B, The recipient mice received cells from FITC-sensitized mice (Normal) or cells from mice that were exposed to UV and then sensitized with FITC. Magnetic beads were used to separate the B220-positive cells (UV-B220+) from the B220−cells (UV-B220−), negative controls (None) were not injected.*, A statistically significant difference (p < 0.05) from the normal control. C, Cell surface phenotype of UV B220+ vs UV B220− cells. Data are expressed as relative cell count vs mean fluorescence intensity (MFI) on a log scale. Numbers indicate the percentage of cells in each population that is positive for each marker.
