
Figure 2.
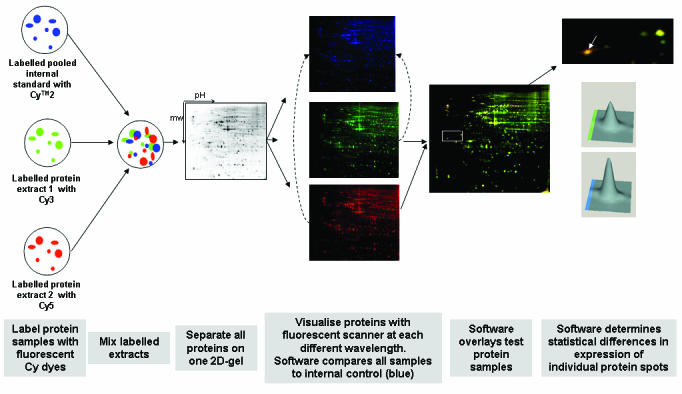
Two-dimensional fluorescence difference gel electrophoresis (2D-DIGE) workflow. Protein samples to be compared are covalently labelled with either Cy3 or Cy5 fluorescent dyes. An internal control, to be run on every single gel in the experiment, is labelled with Cy2. All three samples are combined and separated on the one 2D-gel, thus eliminating gel-to-gel variation. The single gel is scanned at three different wavelengths to generate an image specific for each CyDyeTM fluore. The DeCyderTM software (Amersham Biosciences, GE Healthcare) normalises the test samples to the internal control, and then overlays the two test samples to identify changes in expression levels of individual protein spots. A 3-dimensional view of matched proteins is generated to ensure correct detection of protein spots. As all gels are run with the same internal standard, multiple gels from numerous experiments can all be compared with statistical confidence. Figure adapted from Amersham Biosciences (http://www1.amershambiosciences.com) and reference 42.