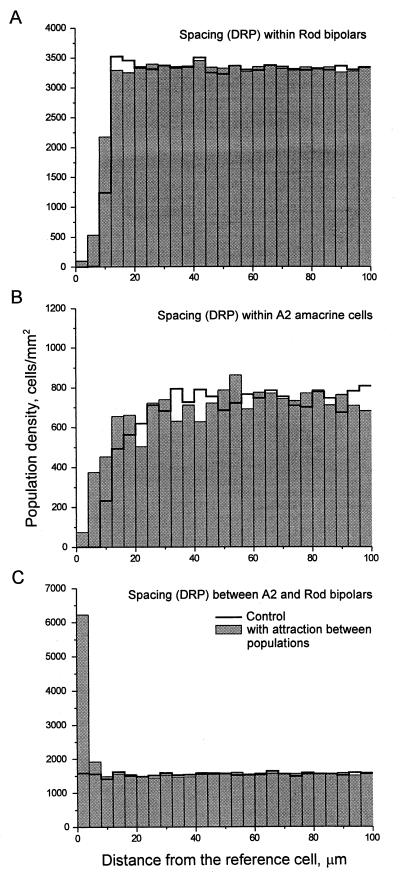
Figure 4.
Simulated populations of rod bipolar cells and A2 amacrine cells. DRPs, like those of Fig. 2, generated under specified rules of spacing, are shown. The shaded bars illustrate the results when cells of the same type were caused to repel each other but cells of different types attracted each other (see text). The unshaded profile shows the DRPs that resulted when the attraction rule was omitted. Results are the means of three simulation runs. Averaged standard deviations for A and C were smaller than 5.1% of the means; for B, they were smaller than 11.5%.

