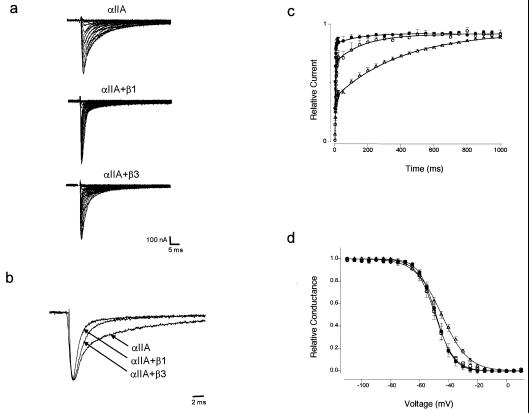
Figure 4.
Coexpression of rat αIIA with rat β3-subunit modifies inactivation kinetics. (a) Na+ currents recorded from oocytes expressing rat αIIA, rat αIIA + rat β1, and rat αIIA + rat β3-subunits. Inward Na+ currents were evoked by applying depolarizing pulses in 5-mV increments from a holding potential of −100 mV, from −80 mV to +30 mV. Duration of the pulses was 50 ms. (b) Normalized Na+ currents from oocytes expressing rat αIIA, rat αIIA + rat β1, and rat αIIA + rat β3-subunits. Currents evoked by a voltage pulse to −10 mV were normalized to peak amplitudes. Inactivation of Na+ currents at −10 mV were fitted with a double exponential decay: I = A1 exp(−t/τ1) + A2 exp(−t/τ2) + C, where A1 and A2 are the relative amplitudes of fast and slow components, τ1 and τ2 are the inactivation time constants, and C is the steady-state asymptote. See Table 2 for fit parameters. (c) Recovery from inactivation of αIIA coexpressed with β1 or β3. The recovery pulse protocol was a 1-s inactivating pulse to −10 mV followed by conditioning pulses to −100 mV for increasing periods of time (from 1–1,000 ms), followed by a test pulse to −10 mV. Points were sampled every 1 ms from 1 to 20 ms and then every 50 ms from 50 to 1,000 ms. Peak current amplitudes measured during the test pulse were normalized to the peak currents evoked during the inactivating pulse and were plotted as function of conditioning pulse duration. ▵, αIIA; ●, αIIA + β1; ○, αIIA + β3. Data were fitted with a double exponential equation: I = 1 − [A1 exp(−t/τ1) + A2 exp(−t/τ2)], where A1 and A2 are the relative amplitudes of recovery and τ1 and τ2 are the recovery time constants. See Table 2 for fit parameters. (d) Voltage-dependence of inactivation of αIIA coexpressed with β1 or β3. A two-step protocol was applied with a conditioning pulse of 500-ms duration from −110 mV to +10 mV in 5-mV increments, followed by a test pulse to −10 mV. Peak current amplitudes evoked by the test pulse were normalized to the maximum peak current amplitude and plotted as a function of the conditioning pulse potential. ▵, αIIA; ●, αIIA + β1; ○, αIIA + β3. Data were fitted with a two-state Boltzman equation: g = 1/{1 + exp[(V − V1/2)/k]}, where g is conductance, V1/2 is the voltage of half-maximal inactivation, and k is the slope factor. See Table 2 for fit parameters.

