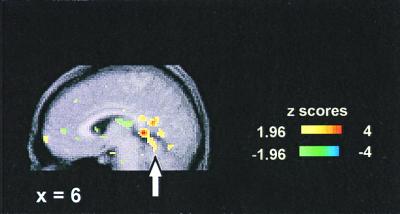
Figure 1.
The correlation of changes in regional cerebral blood flow and the change-of-thirst score derived from 99 PET scans from 10 subjects during the experimental sequence. The sagittal section is at x = 6 mm and shows activations (red-yellow) and deactivations (blue-green). The color coding of Z scores is shown. The activation in right central lobule (III) of the anterior cerebellum is evident (arrow).

