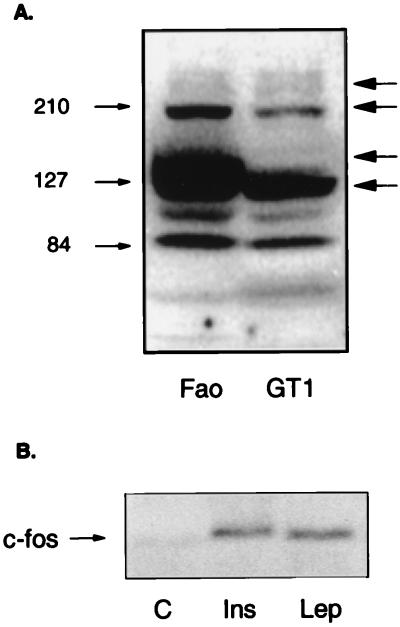
Figure 1.
(A) Different isoforms of OB-R are present in Fao cells. Lysates from Fao hepatoma cells and the choroid plexus cell line GT1 were separated on a 7.5% polyacrylamide gel and blotted with antibody raised against amino acids 32–51 in the extracellular domain of the OB-R. Several bands representing both the long and the short isoforms were detected. The long form migrates as a major band just below the 210-kDa marker, whereas a strong band in the 100- to 120-kDa area represents the short forms. The bands migrating at the 60- to 85-kDa range were not analyzed further and represent degradation products. The specificity for antibody recognition of all of these bands was confirmed by a peptide competition assay. (B) c-fos gene induction by insulin and leptin in Fao hepatoma cells. Fao cells were serum starved overnight and then stimulated with 100 nM insulin (Ins) or 60 nM leptin (Lep) for 30 min (C, control). Total RNA was isolated from control and treated cells, and Northern blotting was performed with c-fos-specific probe as described in Experimental Procedures. Both leptin and insulin were able to induce c-fos expression, proving the signaling capacity of the OB-R in Fao cells.

