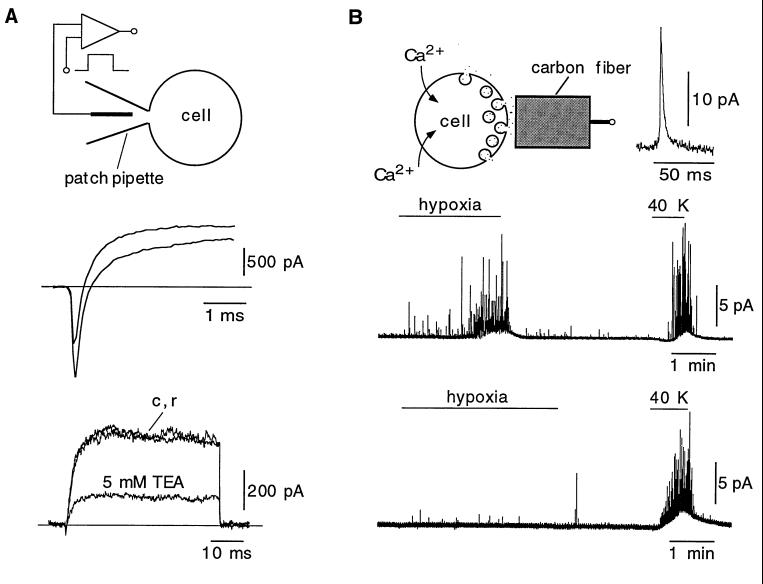
Figure 2.
Electrophysiological and amperometric recordings from individual glomus cells in the slice. (A Top) Macroscopic currents recorded from a glomus cell by using the whole-cell configuration of the patch-clamp technique. (A Middle) Recordings of inward and outward currents from a cell that had particularly large fast inward current. Recordings elicited by depolarizations to +20 and +40 mV from the holding potential of −80 mV are superimposed. (A Bottom) Superimposed recordings from a different glomus cell elicited by depolarizing pulses from −80 mV to +20 mV illustrating the reversible reduction of the current by TEA. c and r are the control and recovery traces, respectively. (B Top) Measurement of secretory activity from glomus cells by amperometry. A large spike-like exocytotic event is shown at an expanded time base. (B Middle) Secretory response of a glomus cell to hypoxia (PO2 ≈ 20 mmHg) and to high extracellular potassium. (B Bottom) Example of a cell that was insensitive to changes of PO2 (nonresponsive cell) but that maintained the typical secretory response to high extracellular potassium.

