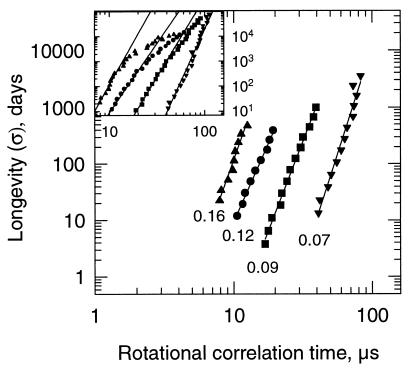
Figure 5.
Relationship between the longevity (σ) of pea seeds and τR of pea axes. The σ was calculated for every 2.5°C at different mcs by using the viability equation (1), with experimental constants obtained from ref. 3. Data were plotted on a double logarithmic scale. Mcs and temperature range for which σ was determined, together with constants and correlation coefficients are, respectively: ▴, 0.16 g/g, 25 to 45°C (a = −4.73, b = 6.79, r2 = 0.964); ●, 0.12 g/g, 35 to 55°C (a = −4.58, b = 5.546, r2 = 0.992); ■, 0.09 g/g, 35 to 65°C (a = −7.14, b = 6.355, r2 = 0.994); and ▾, 0.07 g/g, 35 to 65°C (a = −11.2, b = 7.64; r2 = 0.966).

