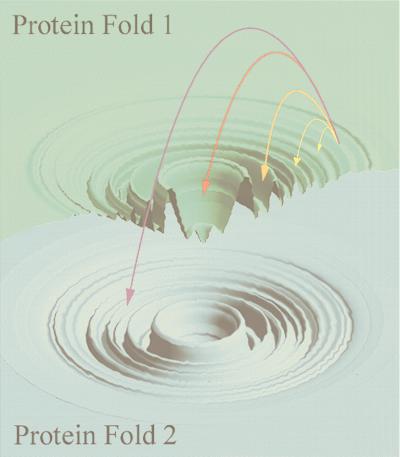
Figure 2.
Schematic diagram representing a portion of the high-dimensional protein composition space. The three-dimensional energy landscape of Protein Fold 1 (green) is shown in cutaway. The arcs with arrowheads represent the ability of a given molecular evolution process to change the composition and so to traverse the increasingly large barriers in the energy function. The smallest arc (light yellow) represents the ability to evolve improved fold function by means of point mutation. Then in increasing order: DNA shuffling (dark yellow), swapping (orange), and mixing (red). Finally, our multipool swapping model allows an evolving system to move (purple arc) to a different energy landscape representing a new tertiary fold (bottom). With this model, functional tertiary fold space has a large yet manageable number of dimensions. That is, in 100 amino acids we assume 10 secondary structures of 5 types (we balance rare forms with the predominance of strands and helices) roughly yielding the potential for ≈107 basic tertiary folds in Nature. Clearly, organization into secondary structural classes represents a dramatic reduction in the realized complexity of sequence space (e.g., versus 300 bases of open reading frame DNA, ≈10170, or 100 amino acids with a 20-letter or 5-letter genetic code, ≈10130 or ≈1070, respectively).

