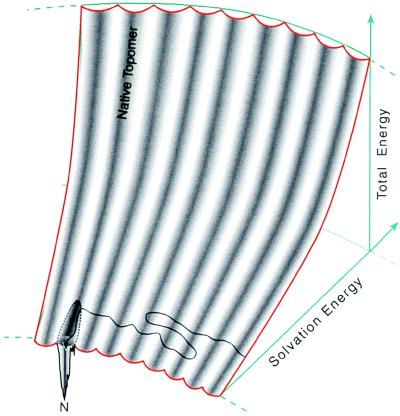
Figure 5.
A representation of the folding energy landscape suggested by the topomer-sampling model. This diagram indicates that structures within the same topomer have a variety of solvation energies (shown along the radial axis). The landscape is shaped like the seating in the Rose Bowl. The total energy is given by the height in the stadium. Conformations with poor solvation energy are situated far from the playing field whereas conformations with favorable solvation energies are situated close to the field. The conformations within a single topomer are distributed in a single, columnar section of the stadium. For a 100-residue polypeptide, the complete folding energy landscape contains 3 × 10⁷ such topomer columns. On this topomer folding diagram, the topomer-sampling model of protein folding is a meandering trajectory (black line with arrowhead) that travels from topomer to topomer, sampling only favorable solvation energy conformations within each topomer. When the protein samples a conformation within its native topomer, specific favorable hydrogen bonding and core packing interactions (represented by a funnel within the native topomer) direct the protein to its unique native structure (N). We show this funnel connected to only a part of the space spanned by the native topomer to indicate that only the favorable solvation energy structures in the native topomer are near the native funnel. Thus, mutations that affect the solvation properties of a protein can drastically affect the time required for a protein to find its native funnel (see text). On this diagram, an early folding nucleation event decreases the number of topomer columns that must be sampled, thereby decreasing the folding rate (by whatever fraction of the total number of topomers is eliminated).

