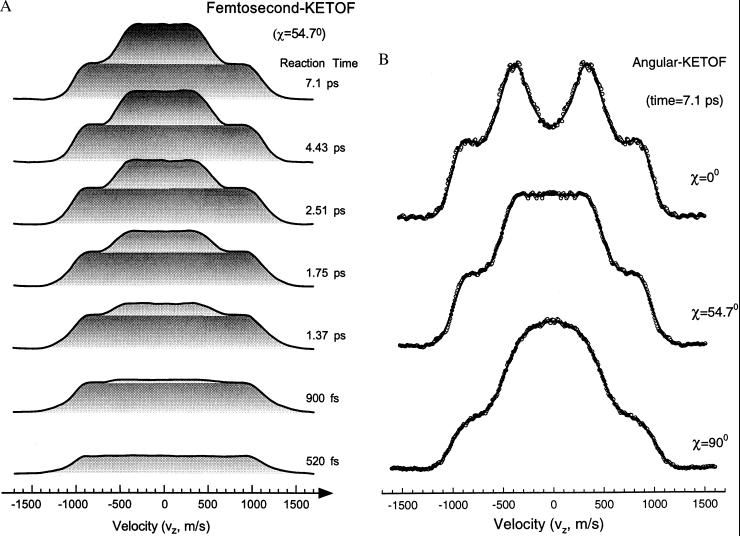
Figure 2.
(A) The fs-resolved KETOF distributions at the magic angle (χ = 54.7°). Note the different temporal behavior for the two velocity distributions. (B) The KETOF distributions of the I-atoms at the three different angles (χ) at 7.1-ps reaction time. The open circles are the experimental data and the solid lines are the results of the theoretical simulation. The simulation procedure (27) only uses the first half (vz ≤ 0) of the KETOF distribution; because of symmetry, the second half (vz ≥ 0) of the data shown here are the replica of the first half.

