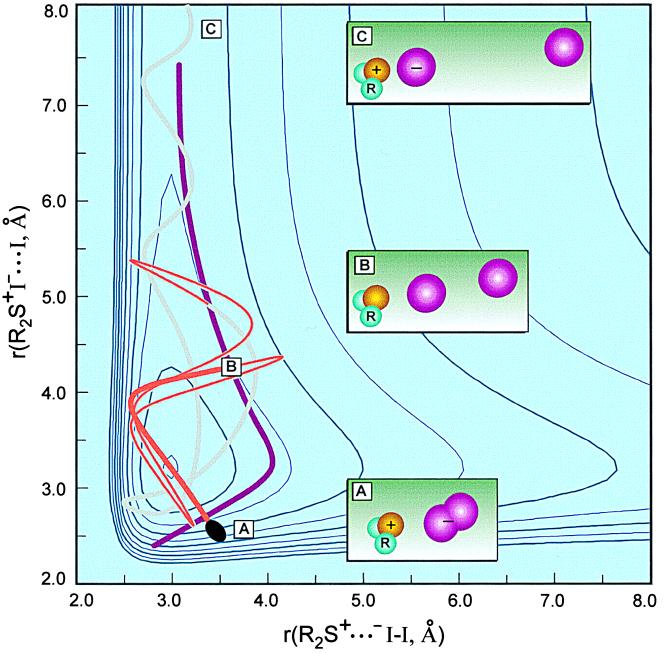
Figure 5.
The potential energy contour map for two of the nuclear coordinates involved, the distance between the donor and acceptor and between the two atoms of the acceptor, both for the ionic pathway. The potential is drawn for ET transfer of 75%, which determines the equilibrium position of the well; see text. The seam (the result of the repulsive I⋅⋅⋅I separation and ionic potentials) also is shown. A trajectory, from molecular dynamics calculations, is shown, together with the three snapshots of the structure at t = 0 (initial wave packet; solid oval), at the seam (thick curved line), and in the final ionic product channel. Note that the trajectory has multiple crossings to the covalent potential and, in this case, this route is the dominant pathway of ET reactions.

