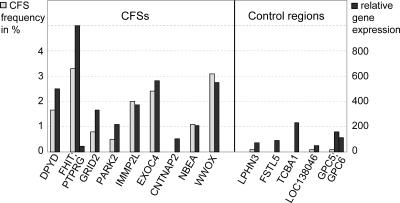
Figure 6.
Expression levels of large human genes (≥650 kb) in CFSs and stable control regions. Shown on the x-axis are the large genes situated in nine of 15 CFSs and in five of 11 control regions. Gray bars indicate the frequency of CFS expression (left y-axis); black bars show the extent of gene expression (right y-axis, based on RNA expression array data from http://symatlas.gnf.org/SymAtlas/).

