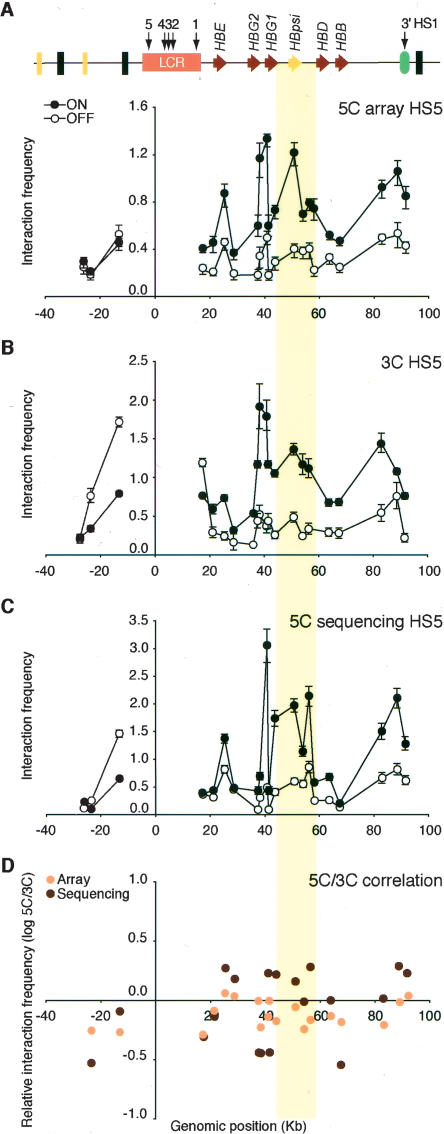
Figure 3.
Microarray and DNA sequencing analysis of 5C libraries recapitulates 3C interaction profiles. (A) 5C analysis of human β-globin locus HS5 chromatin interactions in K562 (ON) and GM06990 (OFF) cells detected by microarray. The y-axis indicates normalized interaction frequencies. The x-axis indicates the genomic position relative to the LCR. Each data point is the average of six hybridization signals obtained with probes of 38–48 bases, and error bars represent the S.E.M. A schematic representation of the entire locus is presented at the top. (B) Conventional 3C analysis of human β-globin HS5 chromatin interactions. (C) 5C analysis of human β-globin HS5 interactions as detected by quantitative DNA sequencing. Error bars indicate the standard deviation. We assumed that count data were drawn for a Poisson distribution and, thus, that the standard deviation equals the square root of the count number. Standard deviations were propagated using the delta method. (D) Correlation between 3C and 5C human β-globin locus profiles from K562 cells. Microarray and DNA sequencing 5C results were compared to corresponding 3C data by calculating the fold difference (log ratio 5C/3C) for each pair of interacting fragments (y-axis). The x-axis indicates the genomic position relative to the LCR. The colored vertical bar across all panels highlights the interaction between the LCR and the region between the γ- and δ-globin genes that contains the β-globin pseudogene.

